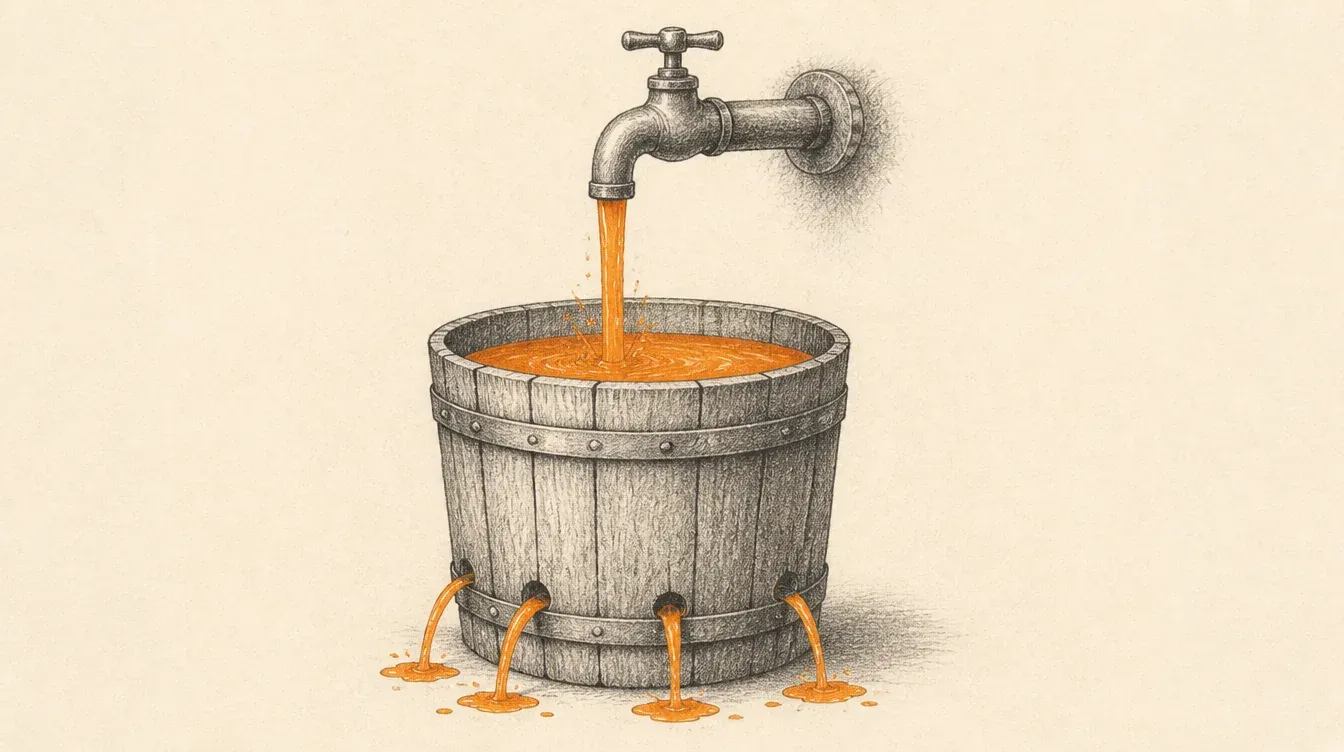
Most of the growth a company loses is not lost at acquisition. It is lost afterwards: in the onboarding nobody finishes, in the second purchase that never arrives, in the customer who leaves without saying anything and without complaining.
The usual answer to that is a reactivation campaign. It almost never works, and the reason is structural: it speaks the same way to people at very different points in their relationship with the business. Someone who never bought, someone who bought once and someone who bought six times have three different problems. One message cannot solve all three.
What we are measuring when we say retention
Retention is the share of customers who repeat whatever defines value in your business within a time window. The definition matters less than the two decisions it hides: which event counts as “repeating”, and how long the window is.
In ecommerce the event is usually a purchase and the window is the product’s natural repurchase cycle. In a subscription business it is the renewal. In a car dealership it can be a service visit, because the next car purchase is years away. Choosing the wrong event is what produces dashboards full of numbers nobody understands, and they end in the most expensive conversation any marketing team has: why does this number not match that one.
One clarification that saves time: in practice, churn is not the inverse of retention. Retention looks at who came back, churn looks at who is not going to. One is counted, the other is estimated, and confusing them is why so many retention reports read like a crystal ball.
The three lifecycle stages
This is the frame we use to segment a base before touching a single message. Three stages, defined by behaviour rather than by how long someone has been around.
Acquisition: zero purchases
People who left their details, registered, enquired or abandoned a cart, and never bought. They are not customers, they are prospects, and treating them as customers is the most common mistake in a badly segmented base.
What they need is not a promotion. They need the one piece of information they are missing in order to decide, and it is almost never the price. It is the specific doubt that never got answered.
Early lifecycle: between the first purchase and the convergence point
This is where most of the leaking money is. A customer who bought once has not chosen your brand yet: they tried it. The probability they leave at this stage is high, and it drops quickly with each subsequent purchase.
It is also the stage with the least automated work in most accounts we audit, because it belongs to nobody. Acquisition already counted them as a conversion, and the loyalty team does not consider them theirs yet.
Mature: from the convergence point onwards
The customer has a habit. Churn risk has settled at a low floor and the communication changes purpose: you stop convincing and start not annoying, raising frequency or basket size, and asking for the thing only a happy customer can give you, which is a referral or a review.
How to find your convergence point
The boundary between the early and the mature stage is not an industry number. It is yours, and it comes out of your data with a calculation that fits into an afternoon.
- Group your customers by order number: those who made one purchase, two, three, and so on.
- For each group, calculate the share that did not buy again within your repurchase window. That is your churn curve by order.
- Find where the curve stops falling sharply and flattens for two consecutive periods. That order number is your convergence point.
What you are looking for is the moment the relationship stops being fragile. In most ecommerce accounts we work with, that point shows up earlier than the team expects, and always in the same place: it does not move month to month, which is what makes it a reliable boundary for segmenting.
Once you have the number, everything else becomes concrete. You are no longer deciding “who gets the loyalty campaign”, you are deciding “what do we say to someone sitting on order two when convergence is at four”.
What to automate at each stage
The order matters. Stage first, flow second. The other way round, automation only multiplies message volume.
In acquisition, short sequences aimed at the objection, not at the discount. Plus a cut-off rule: if after N contacts there has been no signal, that person leaves the active flow. A base inflated with people who will never buy ruins every metric you have and raises your platform bill.
In early lifecycle, this is where the best work belongs. Confirmation that the first purchase went well, the right complementary product at the right moment, and a reminder calculated on that product’s real repurchase cycle rather than a generic thirty days.
In mature, less frequency and more value. Early access, recommendations that assume the person already knows the catalogue, and the review request that only makes sense here.
The condition for this to work is not the tool, it is that the stage lives on the customer profile as an attribute and updates itself. At Takenos that architecture reached 99.8% of users placed in a stage, and that is what made it possible to move from separate per-country campaigns to a single lifecycle engine.
The three measurement mistakes that ruin the diagnosis
Reading the average. A global retention rate goes up when a large cohort enters, even if every individual cohort is leaking faster than the one before. Read it by acquisition cohort, always, and look at the full curve rather than only the first month.
Counting the wrong base. If your customer table only holds people who bought, any conversion rate you calculate will be fantastic and false. This is the mistake that produces those reports showing 100% conversion that nobody questions.
Crediting the last campaign. The message that precedes the purchase takes credit for a process that started much earlier. It is useful for knowing which message closed; it is useless for deciding where to invest.
How to start next week
You do not need a six-month project or a CDP for the first step.
- Define the event that counts as “repeating” in your business, and the window. Write it somewhere the whole team can see.
- Calculate the churn curve by order number and find your convergence point.
- Split the base into the three stages and look at how many people sit in each. The distribution is usually the first surprise.
- Pick one stage, the early one, and build a flow. One.
- Measure against a control group. Without a control you do not know whether it worked, you know the month was good.
That work is exactly what we do in Growth Automation Strategy, and at Bigbox the full setup was live in production in 15 days and then replicated across five countries on a single flow library. The slow part is never the tool: it is agreeing on what each stage means.