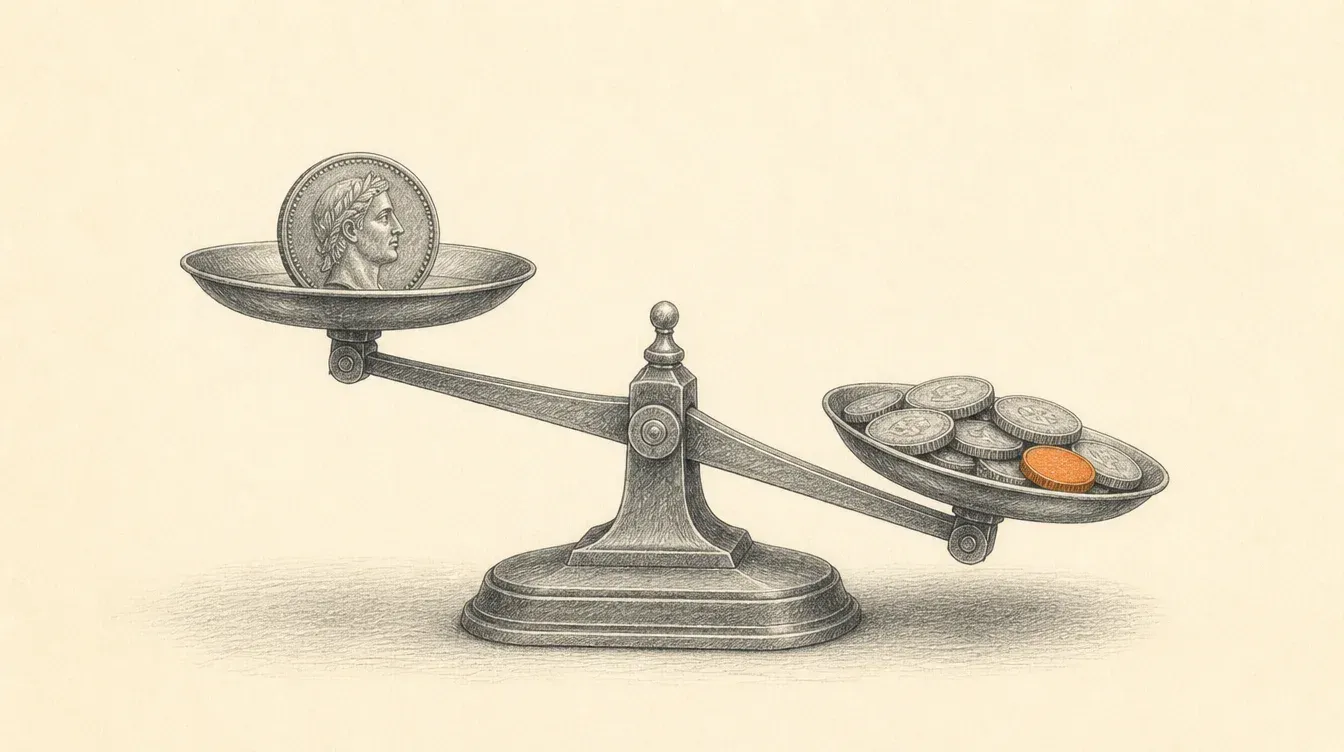
If this semester’s average order value dropped, the first instinct is to look for what broke: did shipping costs go up, did you switch payment gateways, did you lose your highest-value buyer? Before hunting for the error, there is a market-wide number worth checking first: in Peru, ecommerce average order value dropped from S/190 to S/180 in the first half of 2026, a 5.3% drop, according to the Ecommerce Observatory from the Peruvian Chamber of Electronic Commerce (Capece). It is happening to the whole market, not just your business.
The average drops because the channel changed, not because each sale is worth less
In the first half of 2026, Peru’s ecommerce market grew 50.4% to reach US$19.3 billion, and 24.3 million Peruvians (60% of the population) bought online, per Capece. In the same period, digital wallets accounted for 60.7% of ecommerce transactions but only 37.6% of sales volume: mostly small, frequent purchases, not a replacement for the larger card-paid order. On top of that, 701,000 of the country’s 937,610 businesses with an online presence sell through social media, collecting payment through a digital wallet without going through a formal checkout.
Adding those small sales to the same national average as card purchases on a store’s own checkout mechanically pulls the number down, even though no single channel actually got worse.
Why blending every channel into one average is misleading
It is the same problem a CDP solves by keeping data at the customer level instead of a single blended metric: grouping very different sales under one average number hides how each group actually behaves. A national average order value blends the buyer who pays by card in a S/400 cart with the one who buys through Instagram and pays S/40 through a wallet. Neither buyer changed behavior; what changed is how much weight each one carries in the mix.
Three steps to avoid the wrong conclusion:
- Separate average order value by payment channel: your own card checkout versus a sale closed over social media or collected through a digital wallet.
- Look at purchase frequency alongside the average, not the average alone: a channel can sell at a lower ticket per transaction and still generate more revenue per customer if that person buys often.
- Before cutting prices or questioning a campaign over a “low average order value”, confirm which channel the drop came from. If it came from social media or wallets, it is probably new volume, not a customer spending less.
It is the same approach we apply to cash on delivery in Peru: a number that looks bad at a glance can be blending two separate events that are worth measuring apart. It is also the work we do in data marketing in Peru: separate each channel before deciding what to change.
If your average order value dropped this semester and you did not touch prices or switch payment gateways, it is probably not a problem with your business: it is the channel that gained ground.